

• “Red-green color blindness”
• Most often caused by mutations on X chromosome
- Colorblindness is common, especially for people of Northern European ancestry
- Affects up to 8% of men and 0.5% of women
- If your manuscript is sent to 3 male reviewers of Northern European descent, there’s a >20% chance that one of them will be color blind
Sources: Deeb 2005 Clinical Genetics; Katsnelson 2021 Nature
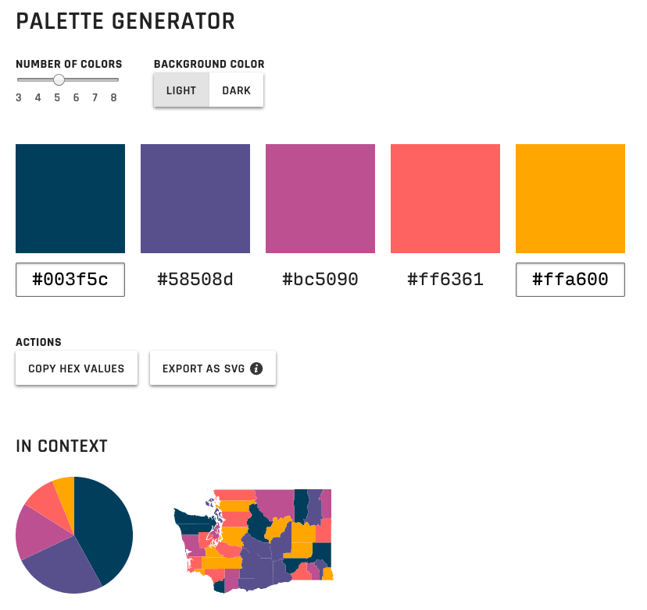
Color blindness simulators & tools for selecting accessible color schemes:
https://projects.susielu.com/viz-palette
R package to simulate colorblindness on R figures: https://github.com/clauswilke/colorblindr
Adobe Illustrator: View > Proof Setup > Color Blindness
created by colorblind scientists Masataka Okabe & Kei Ito

Figure from https://jfly.uni-koeln.de/color/ by Okabe & Ito
For users of R http://www.cookbook-r.com/Graphs/Colors_(ggplot2)/: cbbPalette <- c(“#000000”, “#E69F00”, “#56B4E9”, “#009E73”, “#F0E442”, “#0072B2”, “#D55E00”, “#CC79A7”)


- Use contrasts not only in hue, but also in brightness
- Use shape as well as color to convey differences
- Make graphics grayscale-friendly. Even people with normal color vision may print in black and white!
Suggestions from https://jfly.uni-koeln.de/color/ by Okabe & Ito
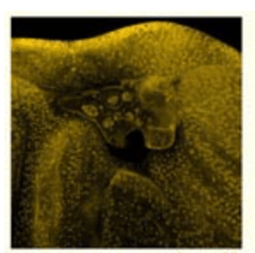
Also avoid red-green contrasts in stained images


Better to convert red to magenta, which can be distinguished from green
Figure from https://jfly.uni-koeln.de/color/ by Okabe & Ito