
Why the Pi?
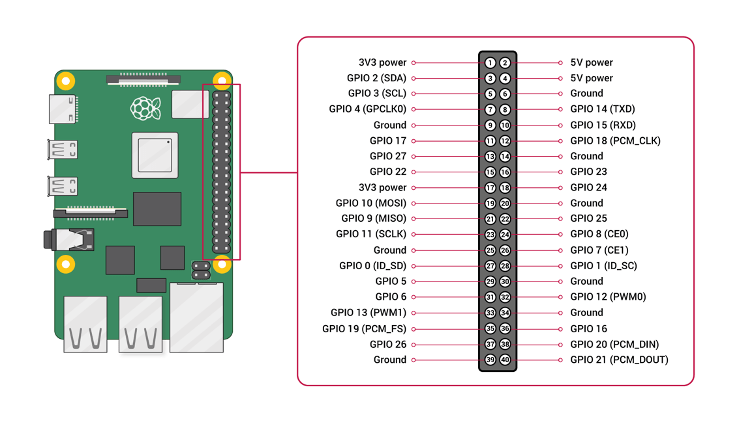
The Raspberry Pi 4 is a versatile piece of hardware, capable of supporting many different peripherals due to its diverse array of ports. The aforementioned flexibility is shown in Figure 1, which illustrates the Raspberry Pi 4’s connectivity:

What Sensors will We Integrate?
For our proof-of-concept, we prioritized establishing the platform foundation and developing the MATLAB GUI with the functionalities outlined above to support three peripherals:
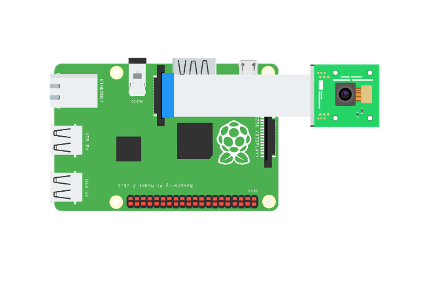
- The Raspberry Pi Camera 2, connected via it’s MIPI CSI-2 ribbon cable.
- The RealTek RTL2832U Software Defined Radio (RTL-SDR) Dongle, connected via USB 3.0.
- The Raspberry Pi’s GPIO Ports, which are integrated into the hardware. Illustration is provided above under “Why the Pi?”


Details regarding sensor integration and testing may be visited in the following blocks:
GUI Layout & Features
The first iteration of this prototype platform uses a GUI developed in MATLAB Apps, which serves as a front-end handling all data acquisition and processing features. Such a GUI is plug-and-play: sans upgrading and bug-fixing, no programming or script-writing is required from the user. In addition, utilitarian design i.e. minimal artistic flair was desired – in traditional engineering fashion, we prioritize function over form:

Since we are prioritizing functionality and user-friendliness, we designed our GUI with the following features:
- A sidebar which allows selection of all supported sensors. Consolidation of all peripheral functionality into a single platform will expedite data acquisition by minimizing the number of separate applications a user must download and learn to use.
- Support for all primary functionalities of supported sensors. For example, compatibility with the Pi Camera will allow the user to perform photo and video capture at a high resolution quality.
- “Hands-free” visualization or data presentation for each sensor. The GUI will automatically select an appropriate way to visualize recorded data for whatever sensors are in use, for example frequency spectrum analyses and time-domain representations of captured radio transmissions from the RTL-SDR dongle.
- Bookkeeping features such as data & figure saving and screenshotting. This is a key feature of all data acquisition platforms, including our prototype, and allows acquired data to be stored and shared.
Data Processing Features
Since our sensor platform should also process acquired data, we implemented features which are commonly used in modern data acquisition platforms:
- Spectrum Analysis, both 1D and 2D. This is done by taking and plotting the Discrete Fourier Transform of acquired time-series data and images using fft, fft2(), ifft(), ifft2(), fftshift() and ifftshift().

- Edge Detection for captured images and video, which allows the user to improve the contrast of persons and objects seen by the camera. This is done by convolving the digital image or video with a user-defined convolution kernel designed to emphasize contrast.
- Filtering features using the following digital filters and parameters:
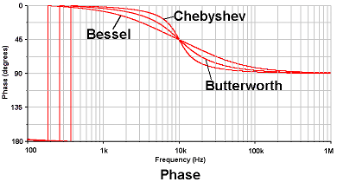
- Chebyshev Filter, which offers rapid roll-off outside of the pass-band.
- Bessel Filter, which offers maximally flat group delay / phase response in the pass-band.
- Butterworth Filter, which offers maximally flat magnitude response in the pass-band.
- The magnitude and phase responses of low-pass renditions of these three filters are shown below to visualize the characteristics:

Data Collection
We acquired a diverse array of data from our Pi 4 sensor platform:
- Time-series voltage readouts obtained from our MCP3008 test circuit via the MCP3008 ADC, sampled at rates between
0 Hz (DC) and 20 kHz
.
- Time-series radio transmission readouts from the RTL-SDR dongle sampled at 44.1 kHz
, the standard audio sampling frequency.
- 1920 x 1080 resolution color images obtained from the Raspberry Pi Camera 2.
- 640 x 480 25 fps (highest possible framerate) color video recorded from the Raspberry Pi Camera 2.