A partnership between UNICEF Mongolia and Washington University in St. Louis/USA
Project Scope
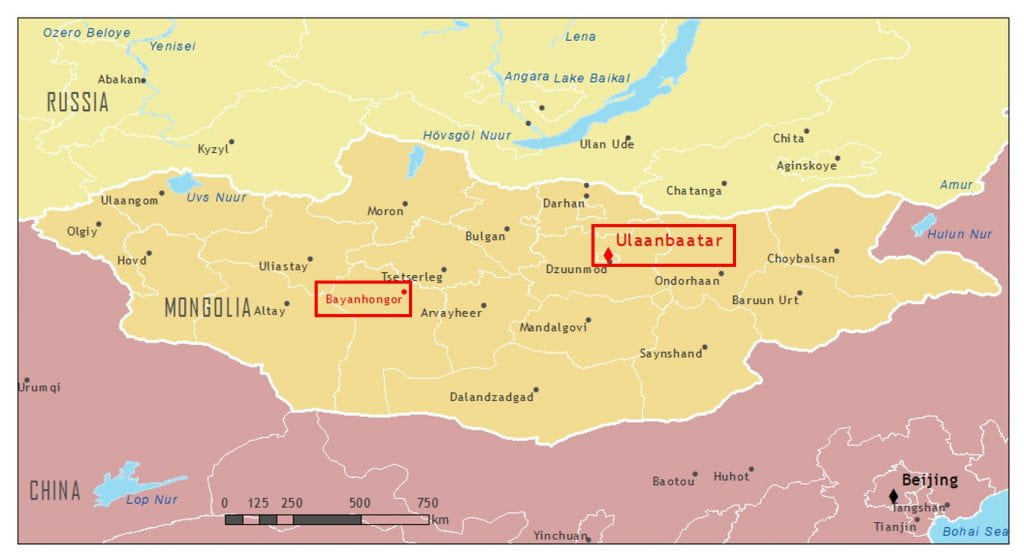
Mongolia has the lowest population density of any country, yet its population centers experience poor wintertime air quality because there is pervasive burning of solid fuels for distributed residential space heating and the cold weather traps these emissions close to the ground. Ulaanbaatar (UB, pop. ~1.5MM) has robust air monitoring but measurements outside of UB are sparse. Through a partnership with UNICEF Mongolia, air quality monitoring is being conducted to measure PM2.5 concentrations including how PM2.5 varies across Bayankhongor (BKH, pop.~30K) and assess children’s PM2.5 exposures in kindergartens, maternity wards, and pediatric hospitals in both BKH and UB. Real time data for these networks are reported here.
 emissions plume from a Heat Only Boiler (HOB)
Collaborators
- Washington University in St. Louis: Zhiyao (Nick) Li and Jay Turner [WashU Lead]
- Mongolian University of Science and Technology: Munkhbayar Buyan [MUST Lead] and Gankhuyag Janjindorj
- University of California, Irvine: Rufus Edwards [Consultant]
- UNICEF Mongolia: Speciose Hakizimana [Acting Representative and Deputy Representative], Altantsetseg Sodnomtseren, Climate Change and Clean Air Specialist], Khishigjargal Batjantsan [Climate Change and Clean Air Officer], Bulgan Tumendemberel, Air Quality Monitoring and Environmental Policy Coordinator], Sunder Erdenekhuyag [Sustainable Energy Coordinator], Bat-Amgalan Gantumur [Civil Engineer] and Alex Heikens [former Country Representative]
PM2.5 Data for Bayankhongor
 A PM2.5 reference monitor (MetOne Model 1020 Beta Attenuation Monitor, “BAM”) was installed in Bayankhongor in November 2019. The monitor measures outdoor air quality and reports hourly average concentrations. Daily averages are presented below using the USEPA Air Quality Index (AQI) classifications. The U.S. Embassy Ulaanbaatar Mongolia website provides health effects and cautionary statements for each PM2.5 AQI classification.
Most-recent week (updated each Monday):

Data from July 2020 to present:

The monitor in Bayankhongor (this project) is the same model and has the same operating settings as the U.S. State/U.S. EPA global network monitors; thus, these data are directly comparable. The following figure shows monthly average PM2.5 concentrations from these two monitors. Bayankhongor population is only ~2% that of Ulaanbaatar but for winter 2019-2020 (November 2019-February 2020) the average concentration is ~2/3 that of Ulaanbaatar. For winter 202-02021 the Bayankhongor average concentration was ~90% that of Ulaanbaatar but relatively low data completeness for the Ulaanbaatar monitor (~50%) may affect this comparison. Also, caution must be used when comparing the concentrations because they can dramatically vary across a city.

* Months with less than 75% data completeness. In these cases, it may be inappropriate to compare monthly averages across sites.
Mongolia Air Quality Data in Context
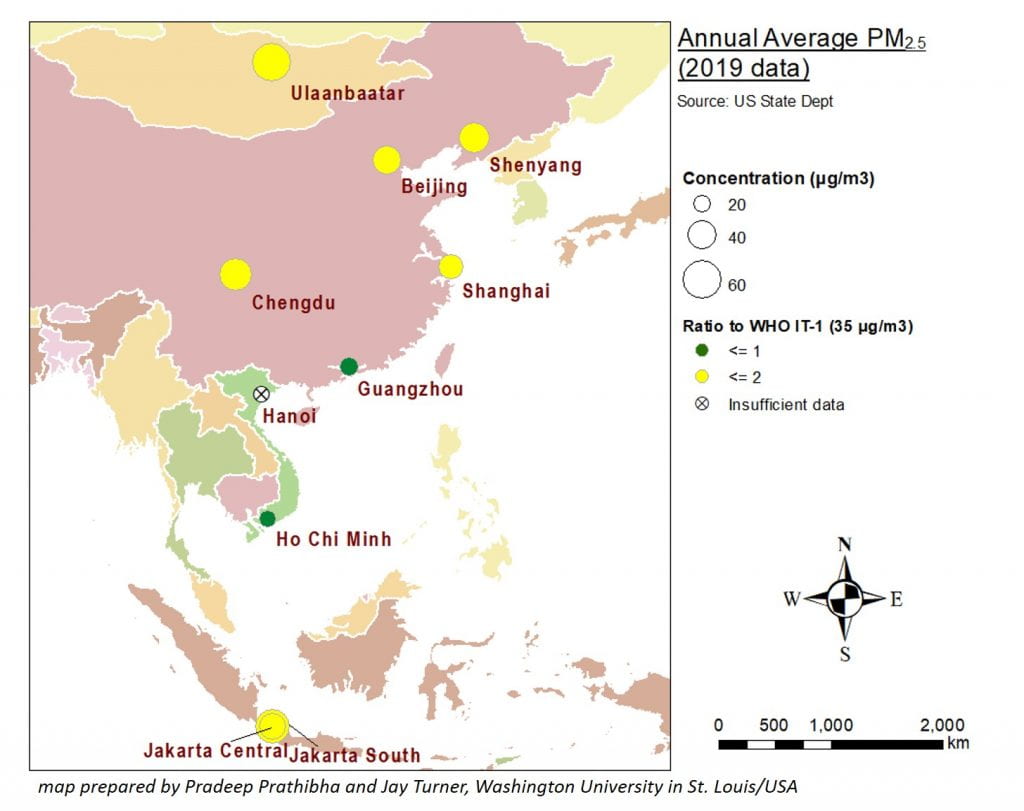
The U.S. Department of State and the U.S. Environmental Protection Agency (EPA) operate a network of PM2.5 outdoor monitors at select embassies and consulates around the world. At each location, the same monitor type and settings are used, and thus data collected across sites are comparable. Data are available from the AirNow website. The following maps show year 2019 PM2.5 concentrations for locations in East and Southeast Asia. The top map shows annual average concentrations. Across these cities, the highest value – 60 μg/m3 – was in Ulaanbaatar. This concentration is six times higher than the WHO Guideline (10 μg/m3) and 70% higher than the most-lax WHO Interim Target (IT-1, 35 μg/m3). The bottom map shows the 99th percentile of 24-hour (daily) average concentrations. Across these cities, the highest value – 331 μg/m3 – was in Ulaanbaatar. This concentration is thirteen times higher than the WHO Guideline (25 μg/m3) and 440% higher than the most-lax WHO Interim Target (IT-1, 75 μg/m3).