Randy L. Korotev
Preface
I wrote this article in 1990 for Nature Notes, the journal of the Webster Groves Nature Study Society (Vol. 62, No. 3, 1990, p. 2-5, the “11-year” version), which was reprinted in The Bluebird (Vol. 60, No. 1, 1993, p. 8–13 ), the journal of the Audubon Society of Missouri, now Missouri Birding Society. I updated it again 9 years later for Nature Notes (Vol. 71, No. 3, 1999, p. 2-20, the “20-year” version). Here, I have updated the text (in 2020) and I present the timetable updated through 2002 (24 years).

Introduction
The JFK (John F. Kennedy Memorial) Forest in the southwest corner of Forest Park in the city of Saint Louis, Missouri, is one of the best traps for migrant passerine birds (“songbirds”) in the St. Louis area. During the spring migration, the density and species diversity of migrant passerines in the ~80-acre forest is many times greater than that of any equivalent area of land outside the city. The main portion of the JFK Forest contains many large trees, a few dating back to the 1904 World Fair, that are ideal feeding areas for those migrants that prefer treetops. There is also a dense understory for the skulkers. Improvements in 1997 of the trails by the Missouri Department of Conservation made the area more accessible to birders. Birding is likely to improve over the next few years following removal of Valley Drive, planting of new trees and shrubs, addition of water features, and maturation of the savanna planted west to the forest.
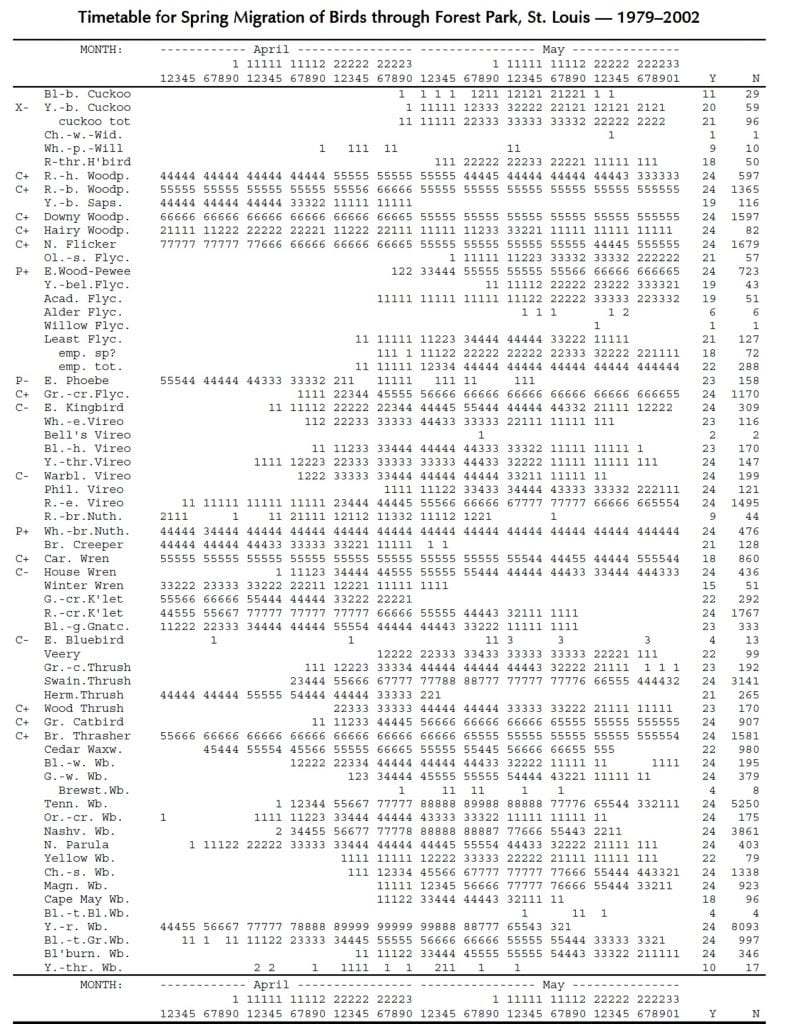
For 24 spring seasons (1979-2002) I kept records of migrant birds that I saw or heard in the JFK Forest during morning birding visits in April and May. I have constructed a migration Timetable, found at the end of this article, from these records. The Timetable is a guide to the number of individuals of each species that birders are likely to find on visits to the JFK Forest on a given date in spring. Within the limitations discussed later, it also indicates timing and abundance for migrant species more generally in the St. Louis area.

Method
From late March through the end of May, I made regular visits to the JFK Forest. Most years I managed to make 30-40 visits (Fig. 1). I usually began birding between 7 and 8 a.m. Early in April and late in May, when there were fewer birds see, I typically birded for about 1 hour. During the height of the migration in early May, I averaged 2-2.25 hours a visit, although I stayed as long as 4 hours on weekends if the birding was good. I recorded the duration of each visit to the nearest quarter hour.
The area that I censused is bounded by Skinker Blvd. on the west, the golf course and Art Museum on the north, the Zoo parking lot on the east, and Wells Drive on the south. I regularly birded the area south of Government Drive. I tried to cover as much of the forest as possible during each visit. Early and late in the season I usually walked about 2-2.5 miles but during the peak of the migration I walked 2.5-3 miles. In order to cover the route in the time allotted, I moved more quickly than most other birders I encountered. Many of my visits were on mornings of light drizzle or immediately following or preceding heavy rain. Perhaps 90% of the time I was birding alone.

I counted and recorded birds one at a time. I probably counted conservatively because I tried not to double count birds as I crossed and paralleled my previous route. Probably 80% of my observations were by ear. In order to get a better record of the migration times for the rarer species, I occasionally included observations made by others if they occurred on a day that I did not visit the Forest; far less than 1% of the observations reported here are of this type.

Most species listed in the Timetable are passerines, but cuckoos, nightjars, hummingbirds, and woodpeckers are also included. In general, I did not count the common resident species (jays, titmice, cardinals) for which numbers do not change much throughout the period, although I counted all the woodpeckers and nuthatches because some species of those groups are migrants. In part because I did not expect to be doing this for 20+ years, I did not count certain common species that are more abundant during the spring migration than in winter or summer (robins, grackles, cowbirds). Although I kept records for ducks, herons, and raptors, those are not included in the Timetable.

Three factors, at least, limit the usefulness of the data that I have collected for drawing conclusions about long-term trends (below). First, I did not record weather conditions. Second, my coverage from year to year was not consistent (Fig. 1). A couple of years (1984, 1996) I missed up to 13 consecutive days because I was out of town; other years (1979, 1991) I birded less frequently. Finally, my high-frequency hearing (>3000 Hz) degraded over the last few years of the Timetable and I did not observe as many birds with high-pitched songs or calls (e.g., Blackpoll and Blackburnian Warblers).

Timetable Description
The Timetable presents the probability of seeing a species on a given date in April and May. It is not an exact report of how many of each species that I actually observed because I’ve smoothed out some bumps and filled in some gaps in order to make the timetable more useful and less confusing. The main portion of the Timetable has 61 columns, one for every day of April and May. Columns are grouped into blocks of five days to make it easier to locate specific dates. The top and bottom of each column are labeled vertically with the day of the month (e.g., a 1 over a 2 means the 12th of April or May). The last column (labeled N) lists the total number of individual birds upon which the row of information is based. These range from 1 for Chuck-will’s Widow, Willow Flycatcher, and Vesper Sparrow to 6103 for Yellow-rumped Warbler. The column labeled Y is the number of years that I have observed the species at least once. To save space, I have abbreviated many species names. The row “emp. sp?” represents all empidonax flycatchers that I could not identify by species. This is followed by a row labeled “emp. total,” which combines all identified and unidentified empidonax flycatchers. Similarly, the row labeled “cuckoo tot.” includes observations from the two previous rows plus any cuckoos that I could not specifically identify as to species. In total, the Timetable includes 106 species plus 1 hybrid (“Brewster’s Warbler”).

Some of the migrants that arrive in spring stay to breed in the JFK Forest or elsewhere in Forest Park (e.g., Gray Catbird and Brown Thrasher ). In the Timetable I have indicated these species by a 2-digit code (see Breeding Key) in the two columns preceding the species name. This information was largely obtained in conjunction with my participation in the Missouri Breeding Bird Atlas Project (1986-1992).
Code Values. The code values in the body of the Timetable require explanation because they are an unusual way to present abundance data. The problem is how to effectively present information for Yellow-rumped Warblers, which average over 20 birds per visit in late April (high of 60), on the same scale as Willow Flycatcher, which I have found only once in 24 years. The code values range from 1 to 9 and the key is given at the bottom of the Timetable. The mathematically inclined will note that the scale of code values is roughly logarithmic; a difference of 1 in code value means about a two-fold difference in abundance. A blank means that I have never observed the species on that date. Some dates on which I have never observed a given species have a code value of 1, but only if I have observed one or more individuals on nearby dates (the gap filling that I mentioned earlier). For every species, however, the first and last non-blank columns represent the earliest and latest dates during April and May that I have observed the species.

As an example of how to interpret the Timetable, for Gray Catbird on May 2 the code value is 5 which indicates that one should expect to find “1 to 2 birds/visit.” So, over 24 years, the average number of catbirds I’ve seen and heard on ~2-hour visits on May 2 and a few days on either side is between 1 and 2 (actually, it’s 1.7). Code values 1 through 4 are more difficult to interpret. For example, for Rusty Blackbird during the first 5 days of April and for Cape May Warbler the first 5 days of May, the code values are 3 or 4. This indicates that one should be able to find an average of about 0.4 birds per visit. While I have, in fact, found a few fractional birds that were the victims of hawks, in this case the fraction means that 5 visits in one year should yield 2 birds or 20 visits over 4 years should yield a total of about 8 birds. For Cape May Warbler in early May, you will probably find 0, 1, or 2 birds on each visit, but 5 visits, even in the same year, will likely net you a total of only 2 birds. That’s not true for Rusty Blackbird, however. I’ve only seen the species one year (1992), when there were about 6 birds on each of several visits (6/20 = 0.33 ≈ 0.4) because the species usually occurs in flocks. In general, the code values reflect averages for visits on a given date over many years better than they do visits over consecutive days in a given year.

Interpretation. The Timetable allows one to pick the days most likely to produce a particular species in spring as well as to gauge the relative likelihood of finding it compared to other species. Some species consistently arrive in early spring while others consistently arrive late. Peak dates for species are evident from the Timetable but are presented chronologically in Table 1. Keep in mind that Table 1 and the Timetable represent a 24-year average. For any given year the ‘pulse’ of birds of a given species will usually be narrower than implied by the Timetable and may occur earlier or later. This timing is demonstrated in Fig. 2 for Tennessee Warbler. In 1987 the peak occurred several days before the average peak date of May 8, whereas in 1980 it occurred nearly a week after. However, the relative order in which migrants appear is usually the same every year. Tennessee Warblers always peak after Palm Warblers and before Magnolia Warblers (Table 1).

Also important to note is that the Timetable is for migrant birds. Nearly any listed species that breeds in the St. Louis area (e.g., Blue-winged Warbler) can be found locally on its breeding grounds a week or more before it is first seen in migrant traps like the JFK Forest or Tower Grove Park. Similarly, many species that have disappeared from the JFK Forest by the end of May can be found in June elsewhere as breeders. Some of those species include House Wrens and Warbling Vireos that breed elsewhere in Forest Park in more suitable habitat. Some species that are relatively common as breeders in proper habitat outside the city (e.g., Yellow-throated and Prothonotary Warblers) are only rarely seen in the JFK Forest as migrants. Thus the Timetable does not represent well, for the St. Louis area as a whole, arrival dates or relative abundances of species that breed locally.

With those caveats, the dates in the Timetable and Table 1 are probably applicable elsewhere in the city, such as in Tower Grove Park. However, it is likely that the relative abundances (code values) of species inferred from the Timetable are different for Tower Grove Park because of the difference in habitat. Thrushes and certain species of sparrows are often mentioned as being more evident in Tower Grove Park (e.g., I have never seen a Clay-colored Sparrow in the JFK Forest although they are seen almost every year in Tower Grove Park).
Other Species
In total, I have observed 158 species of birds in, over, and around the JFK Forest during my spring birding visits. In addition to those listed in the Timetable, observed species include (1) migrants that are often seen flying high over the Forest but which are not principally forest species (cormorants, herons, egrets, geese, hawks, shorebirds, gulls, swifts, swallows), (2) migrant non-passerines that sometimes rest in or feed in or over the JFK Forest (Green Heron, both Night-herons, Turkey Vulture, Osprey, Mississippi Kite, Sharp-shinned Hawk, Cooper’s Hawk, Broad-winged Hawk, Red-tailed Hawk, American Kestrel, Merlin, and Peregrine Falcon), (3) some park-resident non-passerines (Wood Duck, Mallard, Eastern Screech-Owl, Great Horned Owl, all of which have bred in the Forest), (4) resident birds of the St. Louis area that are not usually found in the JFK Forest, but which occur there some years (Wild Turkey, Northern Bobwhite, Barred Owl, Pileated Woodpecker, Eurasian Tree Sparrow), and (5) species that don’t belong there at all (Peacock – twice!).

The spring migration is not usually noted for out-of-range rare passerines, but a few observations from the JFK Forest that are not in the Timetable are noteworthy. On May 12, 1982, two birders identified a Black-headed Grosbeak, and on May 10, 1984, several birders and I enjoyed a Lazuli Bunting. On March 29, 1998, much earlier than expected, I saw an Orange-crowned Warbler that I believe was the lutescens (Pacific coast) subspecies.
Long Term Trends, and Some Opinions
Several years ago, a long-time St. Louis birder said to me, “There just aren’t as many Black-throated Green Warblers as there used to be. When I started birding, I would often see 20-30 in a day.” I have often heard others voice similar sentiments.

These impressions may be correct, but I suspect birders may have selective memory. We all remember those few special days when the warblers were as thick as Christmas tree ornaments, but we tend to forget about the ho-hum days – and ho-hum days were just as prevalent 20-30 years ago as they are now. Some species are clearly decreasing, and others are increasing in abundance. Even when one has “facts” in the form of many years of recorded data, as I do, I don’t believe one can draw many valid conclusions about long-term trends from birds observed in migration. There are too many variables that influence the number birds we see in spring from year to year that have nothing to do with long-term decreases or increases.

Weather is probably the most important factor. No two springs are the same with respect to weather and how the plants, insects, and birds respond to it. On any given day or any given spring, the birds we see in Tower Grove Park or Forest Park have been influenced by local, regional, and global weather. The overall effect is that in some years those weather patterns cause a lot of birds to descend on St. Louis in spring. If we’re lucky, those same weather conditions cause the birds to stay here for several days. If we’re very lucky, those days happen to include Saturday and Sunday, everybody gets to see the birds, and we all think it’s a great year. Over the years I’ve had a number of great Tuesdays, bird-wise, and I saw no other birders to share the experience.
Keeping these caveats in mind, I have given each of 20 years a score on a 1-to-10 scale based on the number and variety of migrant birds that I’ve seen each year (Fig. 3). I’ve used different recipes to arrive at these scores and they all come out about the same, so the figure shows the averages.
Clearly, 1983 was a good year. On 3 successive days that year I saw 11-13 Blackburnian Warblers and on May 7, I found 28 species of warblers, so I defined 1983 as a 10. In contrast, 1998 was a dud (I saw only one Blackburnian Warbler all spring), so 1998 gets a score of 1. On that scale, most years have been in the 3 to 4 range. Others might interpret Fig. 3 differently, but I don’t see evidence for a decline over time. There appear to be occasional great years and bad years, with most years being fair to good.

It would be interesting if someone with similar data for Columbia or Kansas City, MO, or Springfield or Chicago, IL, would also rate the years. It would not surprise me if different years scored high and low in nearby Midwest cities because of differences in local weather.
On numerous occasions I’ve encountered some unusual species, such as Prairie Warbler, only to find a bird of the same species the next day in about the same spot. Some individual birds seem to arrive on a good migration day and then stay for several days. The most extreme case occurred in 1982, when I first heard a Blackpoll Warbler in a tree across the street from where I parked my car on April 19th (the earliest date for the species in the Timetable). Nearly every day for the rest of the month I heard a Blackpoll Warbler calling from the same tree. Not until April 30th did I encounter more than one Blackpoll Warbler. In 1997 I spotted a Gray-cheeked Thrush with a couple of white feathers in its wing. For the next 6 days, the same “marked” bird was seen in the same general area by someone. Thus, if in some years weather conditions are such that a number of birds arrive and do not leave for a while, it gives the impression that there are many birds compared to years when they pass through quickly.

May 8
In the 11-year version of this article I ended by saying that if you only have one day to bird in spring, do it on May 8. I’ll stick with that date. On average, the total number of warbler species peaks on May 8 (Fig. 4), as do the total numbers of birds. In any given year, however, the peak may be several days before or after.

Timetable

Timetable as PDF, 2 pages, 54 kb
Thanks to She who refers to me as her “wasband” for proofreading.