CatBoost
We expected CatBoost’s results to be slightly better than 50%, given the unexpected nature of the market. If we take a simple look at the general results, this seems to be the case. The total accuracy was approximately 51%. Though 51% correctness isn’t sufficient to trade on with a simple strategy, we thought that breaking down this accuracy would provide insight into how we can more confidently use our algorithm to trade. We decided to determine if the model was particularly good at guessing a certain direction. It turned out that the model’s “up” predictions had 62.3% accuracy, whereas the model’s “down” predictions had 44.7% accuracy. This result signifies that our model was better at generating up predictions. We believe this to intuitively make sense based on the features of our model. Since we use intrinsic metrics for stocks as well as a feature measuring market movement (S&P level) it would make sense that our model is more confident in predicting upward movements, presumably when it seems that the market is moving healthily and company fundamentals are strong. Downward predictions are harder to generate because of inconsistencies in the market and impromptu negative news events. With this in mind, we postulated that the most successful trading strategy would involve trading only on up predictions. Below is a graph breaking down accuracy by stock by type of prediction.

Linear Regression
We anticipated the linear regression’s results to be little better than 50%. The method has obvious weaknesses and relies solely on the (often errant) predictability of trends to profit. Because the linear regression model was able to predict exact prices, it gave us more flexibility in our ability to display the data. Below is a prediction vs actual chart of the 5 day prediction for Caterpillar stocks across all 665 days. The chart is similar to those of the other stocks within the Dow Jones – the prediction seems to overshoot in value and slightly lag in time:

This is in line with the regression’s method. Because the prediction relies on four past days, we expect it to reflect recent historical changes.
In regards to the Linear Regression’s up/down predictions: accuracies were calculated for up/down movement of predictions vs actual up/down movement across 24 of the stocks in the DJIA. The 5 day prediction model totalled 49% accuracy and the 1 day prediction model supplied a 51% prediction accuracy. These results were right along the lines of what we were expecting – near to 50%.
We analyzed the method in another metric – profitability in accordance with a trading strategy. In order to fairly analyze the linear regression’s value against the CatBoost method, we set the 5 day prediction model against the CatBoost method and utilized the same trading strategy for both. Every time we had an upward movement prediction, 100 dollars was invested. When involving 24 of the stocks within the Dow Jones, the 5 day linear regression model’s total return was -1.09% – solid evidence that the method is not a useful tool for stock price prediction.
Trading Strategy
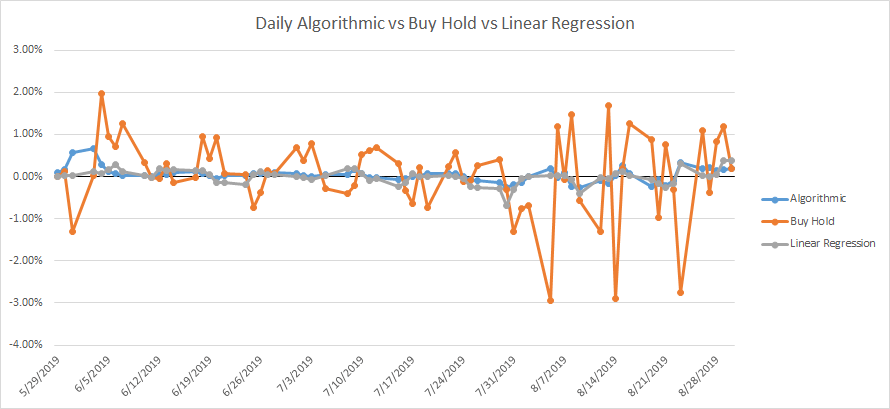
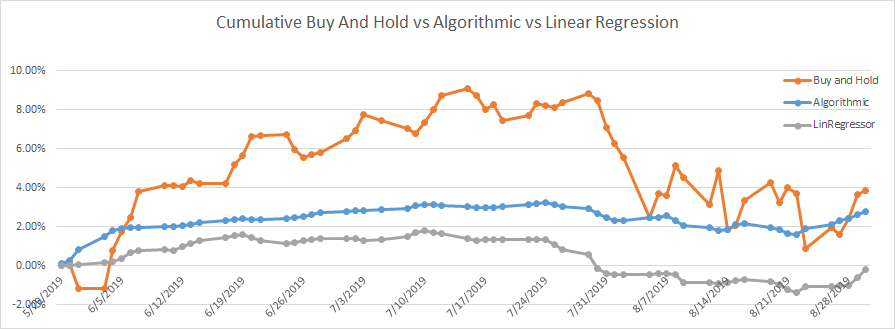
Our trading strategy consisted of trading a fixed amount (we used 100 dollars in our simulation as the fixed amount) on every up prediction. Using this strategy, we only need to hold $12,000 on any given day. In practice we’d really only use a fraction of this amount, as $12,000 dollars will only be invested if our model has predicted up predictions for all 24 stocks 5 days in a row. Using the $12,000 notional amount, we conducted a trading simulation over the period 5/29/2019 to 8/30/2019. Over this 3 month period our model earned 2.80% while a buy and hold strategy for these 24 stocks would have earned 3.87%. The linear regression method’s total return was -1.09% and followed the same strategy of CatBoost – invest on up predictions. The below figure shows the daily returns of all three methods.
Although in the end our algorithm returned less over the period, it can be seen in this comparison of cumulative returns between buy and hold and algorithmic strategies that our model provided a much less volatile return. This is partially attributed to using a fraction of our total capital each day as opposed to the entirety of the capital (as buy and hold does), but mainly results from being correct more often than not about up predictions. Below is a graph that details cumulative performance of buy and hold, linear regression, and algorithmic returns.
Our model generally provides slightly positive returns each day, providing investors with a sense of security. Even on the market’s worst days (take 8/27/2019 as an example), our algorithm still generally delivers a positive return.