These graphs and statistics result in various compilations of the data in the City on a Hill Archive. They show trends of the uses and other variables in multiple situations. To manipulate the data situations yourself, continue to the “Search the Database” page.
Volumes referring to the USA as a “City on a Hill” or a Variant of the Phrase by Decade.
Volumes referring to the USA as a “City on a Hill” or a Variant of the Phrase Scaled by Population by Decade.
Volumes with Explicit Reprints, References, and Quotations of Winthrop, Kennedy, and Reagan by Decade
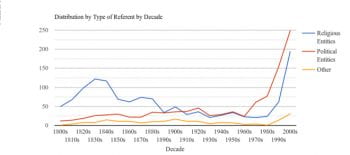
Distribution by Type of Referent by Decade
Distribution by Type of Referent by Decade Scaled by the Number of Volumes in Hathitrust
Distribution by Type of Referent by Decade Scaled by the USA population
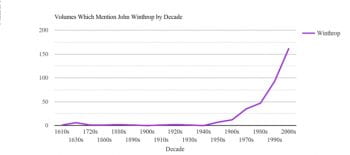
Volumes which Mention John Winthrop by Decade
Volumes which Mention John Winthrop, Puritans, and New England by Decade